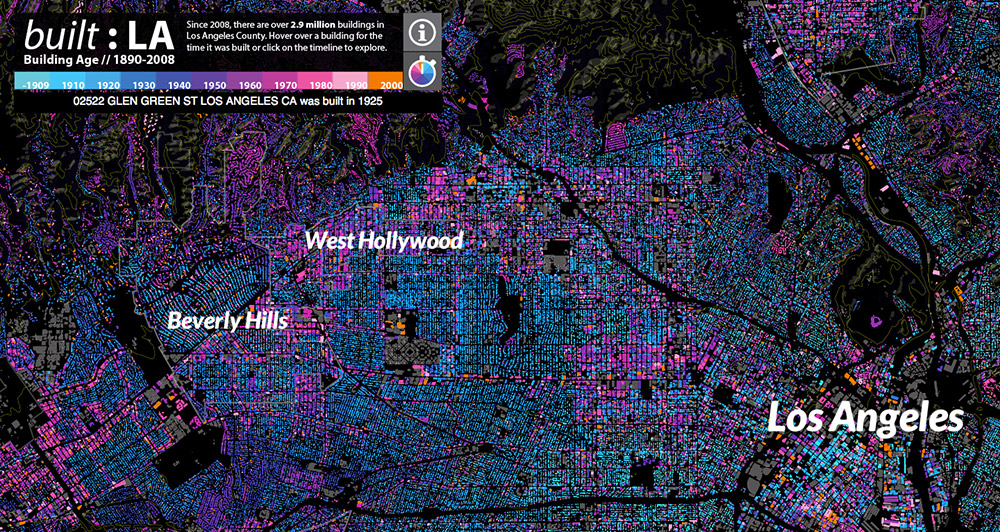
The fine people at CityLab yesterday announced built: LA, an interactive mapping project that plots the age of nearly every building in Los Angeles.
From CityLab:
“Using open data from local governments, built: LA visualizes the age of roughly 3 million buildings across L.A. County constructed between 1890 and 2008.”
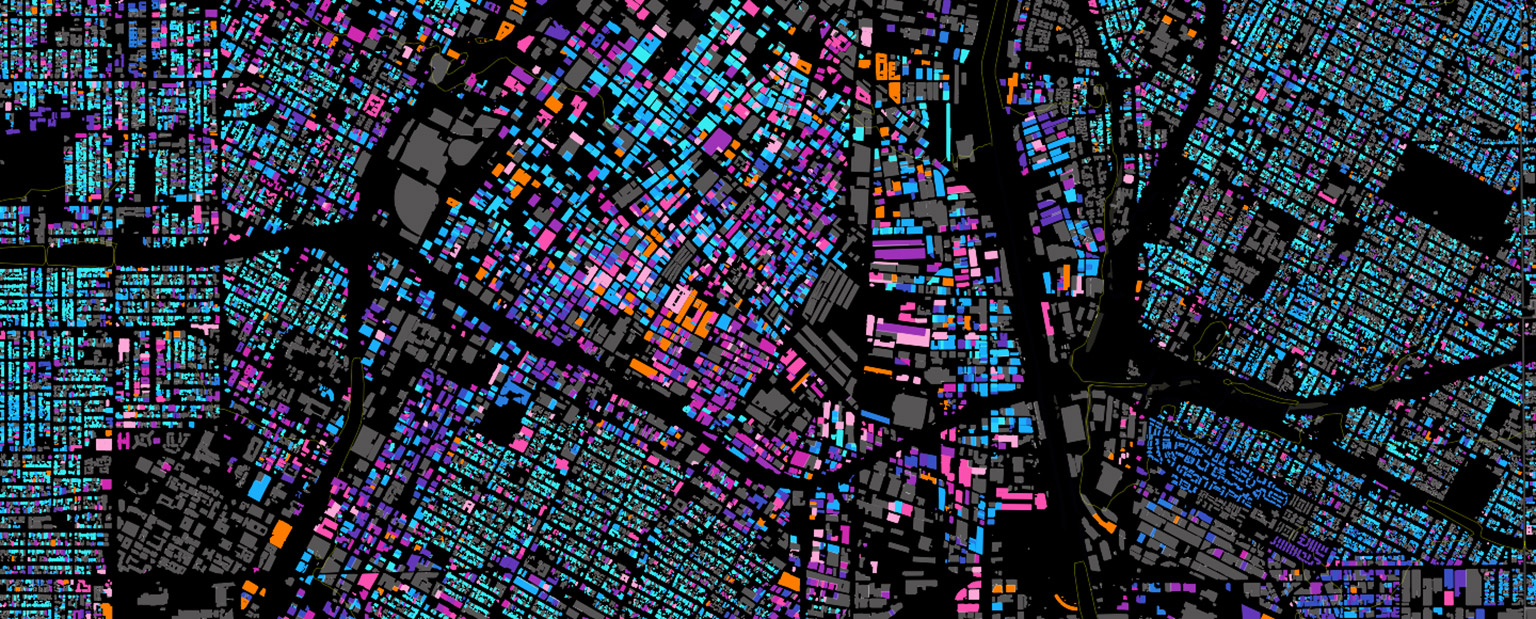
The result is a zoomable map that displays the year of construction for all structures in the massive database as you roll over them in your browser. While fascinating in a functional, informative sense, it also strikes us as a beautiful marriage of data + design, reminiscent of the seen from overheard at night.
Our place, sadly, does not seem to be included in the data, but most of neighbors’ are. And we just love how Beachwood canyon is this glowing hand of development reaching up into the undeveloped wilds of Griffith Park.
Give it a go yourself. And be sure to click on the interactive timeline and stopwatch to see the development span through the years. Just make sure your browser’s up-to-date…or you likely won’t see anything at all.
built: LA was developed by Omar Ureta of the Urban Policy Collective at Roschen Van Cleve Architects and made with Mapbox Studio and Mapbox-GL, inspired by Portland, Oregon: The Age of a City; terrain + label data by Mapbox. OpenStreetMap, under ODbL.